
25 Aug 2014 Put On Your Streaming Shoes

The Kick-Off Meeting
It went something along the lines of:
- Client: “We have a new requirement for you..”
- Shiners: “Shoot..”
- Client: “We’d like you to come up a solution that can insert 2 million rows per hour into a database and be able to deliver real-time analytics and some have animated charts visualising it. And, it should go without saying, that it needs to be scalable so we can ramp up to 100 million per hour.”
- Shiners: [inaudible]
- Client: “Sorry, what was that?”
- Shiners: [inaudible]
- Client: “You’ll have to speak up guys..”
- Shiners: “Give us 6 weeks”
We delivered it less than 4.
Getting Started
Of course, in reality there was a smidgen more dialogue in the kick-off meeting than what I’ve made out in the above ‘transcript’. Such things like the source of the data, how was it structured and the general requirements of the visualisation were discussed and fleshed out in some more detail.
The source of the data was millions of ad impressions from our client’s numerous high-profile/traffic sites, its structure was nothing special (I won’t bore you with that) and the basic requirements for the animated visualisation was that it should “look sexy and be moving, updating and changing colours as the new data pours in!“.
The velocity, i.e. the speed at which the data needed to be consumed, would need some sort of real-time streaming functionality to realise that part of the project. The volume, i.e. the size of the data, would need some sort of massively parallel and scalable database that could interrogate the large dataset in seconds and also have the ability to query the new data real-time as it was streaming in.
So why, given these complex and challenging requirements, were we so quickly able to estimate it and then, on top of all that, deliver it 2 weeks early? Well, as it turns out we had just recently completed another project using BigQuery (Google’s bleeding edge, big data analytics tool) and we knew straight away that it would be able to handle the volume of data we were up against and also be able to query it interactively. First box ticked.
Jackpot

But there was still a question mark around the real-time streaming. We hadn’t done anything on that sort of scale before. Traditional RDBMS’s are usually associated with batch loading and not streaming millions of rows in real-time. We started to question whether this was even possible. Did any technology or framework even exist that we could use to implement it?
Some memorable on-the-spot thinking and frenetic googling by one of one our developers mid way through that conversion (the first inaudible) and we hit the jackpot. Not only is BigQuery an extremely powerful analytics tool but, who would have guessed it!? Yup, it also comes equipped with a pretty awesome streaming API which allows real-time row insertion into tables. Second box ticked. RESULT!
We weren’t quite there yet and even though we had ticked the first two (hardest) boxes we still needed to be able to visualise the live data updating and that wasn’t going to be a walk in the park either. After some quick sniffing around on the interweb we came across Chart.js and it looked like it would be able to do the job nicely. All we would have to do would be to knock up a straightforward Spring application to interrogate the data in BigQuery and then feed those results back into a JavaScript front-end for Chart.js to consume and produce some nice engaging, animated charts.
Final box ticked.
Before moving on, let’s remind ourselves of the numbers again to put the volume and velocity of the data we needed to process in perspective. 2 million per hour which is 48 million a day, 1.4 billion a month or 16.8 billion a year. That’s a lot of zeros. In fact, it’s so many zeros that I feel compelled to write them all out to make it even more dramatic:
- 2,000,000 per hour
- 48,000,000 per day
- 1,400,000,000 per month
- 16,800,000,000 per year.
Nice.
The Streaming API
BigQuery’s streaming functionality works by simply hooking into its RESTful API and sending a post request over the wire to insert the data/row(s). That’s really all there is to it. However, there are a few hurdles to overcome first like setting up the authorisation, understanding the quotas in place and working around a few quirks in the API.

There are plenty of client libraries available so you can decide on your favourite weapon of choice. For the actual streaming of the data we landed on PHP. This was because it was already heavily used within our client’s environment and unfortunately we didn’t have any other languages or technologies at our disposal on the web tier of their infrastructure. As already mentioned, for the visualisation side of things we combined the JavaScript and Java clients.
The ultimate design of our application was a standard three-tier architecture. Nothing out of the ordinary here:
- PHP: server-side streaming of the events real-time into BigQuery
- Java: server-side Spring app responsible for querying the live data in BigQuery, performing some smart caching and returning JSON responses to the front-end
- JavaScript: front-end client talking to the Java app and feeding results back into Chart.js
Quotas
There are some tradeoffs associated with streaming data into BigQuery. It’s got some quotas in place that you’ll need to take into consideration before deciding to roll with it.
- Maximum row size: 20 KB
- Maximum data size of all rows, per insert: 1 MB
- Maximum rows per second: 10,000 rows per second, per table
- Maximum rows per request: 500
- Maximum bytes per second: 10 MB per second, per table.
The restriction on the max rows per second immediately jumped off the page at us when we first saw it and we quickly fired up a calculator and started crunching the numbers (the second inaudible) and discovered that 10K per second would be a little tight given our future requirements to ramp up to 100 million an hour!
No matter though. On the same page it also states that if you require more then simply “contact your sales representative” which translated for us into “totally doable”. They lifted our cap to 50K per second within one business day. Too easy.
The Warm Up Period
When you first start streaming your data in BigQuery you might find yourself writing your first query so you can admire your brand spanking new, freshly streamed real-time data only to be confronted with this:

WTF?! Where’s my data? Is BigQuery broken? Why didn’t it work? Is it my code? Why oh why did I become a software engineer?! This streaming thingy really sucks.
Fear not my friends. It’s simply the ‘warm up period‘ as Google like to call it. When you first start streaming in your data, BigQuery won’t expose it for up to 2 minutes according to the documentation. In other words, it won’t be immediately available for analysis. It’s still there but it’s hidden in the deepest reaches of Googles data centre. Just be patient and it will soon appear – unless you really do have buggy code! Finally, if you then stop streaming data for a few hours the warm up period will kick in again and reactivate on the next insert. So just bear that in mind.
However, during our initial testing we never encountered a warm up period of more than 30 seconds or so.
It’s A Business

Remember, this is a business. A very big business actually. And just like every other business Google are out to make money. In fact, at their cloud platform event back in March, Google made a very bold statement that their cloud revenue will surpass the advertising side of the business in the not so distant future. Wow.
Thus, it will come as no surprise then to anyone reading this, that just in the same way you are charged to query your data in BigQuery you will also be stung a fee for streaming it in. However, it’s ludicrously cheap. In fact, it’s actually free until January 1st 2015. After that you’ll be charged $0.01 per 100K inserts. Better start saving then.
So, remember – you’ll pay for streaming your data in (after the Jan 2015) then pay for querying it and finally for storing it in BigQuery. That’s three areas of costs you’ll have to factor in when looking at this type of solution. But with the prices so low now it’s hard to imagine that it could be a showstopper for anyone.
- Queries: $5 per TB
- Storage: $0.026 per GB per month
- Streaming: $0.01 per 100K rows streamed (after 01.01.2015)
In recent months there has been a rapid slashing of prices from both Google and Amazon as the cloud becomes ever more commoditized and they compete against each other to get our business. Google proclaim it’s Moore’s Law and it’s only set to become even cheaper. Even cheaper? Are you kidding me?! That’s great news for all of us and the combatants in the ‘Cloud Wars’ are only just getting their lightsabers warmed up.
The Nitty Gritty
As already mentioned we were going to be streaming our ‘events’ (the data) server-side off a web tier of 10 Apache nodes which were handling 2K requests per second at peak. These events were triggered by an impression or click of an advertisement on our client’s publisher network.
We built a simple endpoint in PHP that used the Google PHP library to stream the events into BigQuery. This endpoint was wrapped up in <script> tag and delivered with the advertisement when it loaded on the browser, thus causing it to fire and initiate the stream to BigQuery.
<script>http://stream.me.bigquery.com/StreamRow.php</script>Within the actual endpoint that streams the data to BigQuery, the first thing you’ll need to navigate is the OAuth 2.0 setup. There are a few possible ways to do this but the server to server process was the obvious choice in our case. It works by going to your Google developer console, clicking “create new client key” and selecting the “service account” option. It will generate a private p12 key and some other details like the “client id”.
Take the private key that’s just been generated and pop it into your project directory somewhere. When configured correctly the Google client library will then automatically sign each of your underlying requests to BigQuery using the private key provided. It’s a little finicky to get setup so here’s the code (insert your details from the developer console):
//Create a google client to talk to BQ $client = new Google_Client(); $client->setApplicationName("Foo"); $service = new Google_Service_Bigquery($client); $key = file_get_contents([YOUR_PRIVATE_KEY.p12]); $cred = new Google_Auth_AssertionCredentials([YOUR_SERVICE_ACCOUNT], array('https://www.googleapis.com/auth/bigquery'), $key); $client->setAssertionCredentials($cred); $client->setClientId(YOUR_CLIENT_ID);Next you’ll need to construct the payload. This is the row that will be streamed into BigQuery. You’ll need to have the table already created in BigQuery and with the correct schema before firing the request:
//build the payload $arr = array ( 'name' => 'Graham', 'birth_town' => 'Dublin', 'lives' => 'Melbourne, Australia' 'hobbies' => 'Mountain Biking and Beer' 'time_stamp' => time() );Finally, pull the trigger and stream the row into BigQuery!
$service = new Google_Service_Bigquery($client); $payload = json_decode(json_encode($arr)); $rows = array(); $row = new Google_Service_Bigquery_TableDataInsertAllRequestRows; $row->setJson($payload); $row->setInsertId(null); $rows[0] = $row; //Stream the event into BQ $request = new Google_Service_Bigquery_TableDataInsertAllRequest; $request->setKind('bigquery#tableDataInsertAllRequest'); $request->setRows($rows); $response = $service->tabledata->insertAll(PROJECT_NUMBER, DATA_SET, TABLE, $request); //fire the insert requestAnd hey prezzo, you’re all done. Obviously, this is a simple example showing just streaming one row. You can of course batch them up and stream up to 500 in one request.
Some Socket Magic
When we started load testing our streaming component we immediately hit a pretty big obstacle. The request to stream the data into BigQuery was simply too slow for us. Each request was averaging 1500 ms to execute. You probably already guessed by now why!
But if not, remember – under the hood it’s nothing more than a simple HTTP Post request and thus the server will always wait for the response to be returned before proceeding. Doh!
That obviously meant that the client would be left hanging while the data was being streamed. That’s not cool. Now, if we had used another language or framework to implement it this wouldn’t have been an issue at all. Simply make the streaming call to BigQuery asynchronous and we wouldn’t have thought anymore about it. Simples. But this was PHP. And we all know PHP is a single threaded language and not inherently asynchronous. Yes, this was a different animal altogether.
But we see obstacles as inspiration.
A quick search on how to make asynchronous calls in PHP without using any additional software, libraries or extensions unearthed a few different approaches (or hacks) to somewhat mimic an asynchronous call in PHP. Three of the most common suggestions:

- Write to a log file(s)
- Fork a
cURLprocess - Use some socket magic
We took a look at all of them. Writing to a log file seamed like a reasonable approach but it would have taken quite a bit of effort to implement, wasn’t truly real-time and you can get into all sorts of problems with file locks if you go down that path. Forking a cURL request simply wasn’t possible for us as we didn’t have the permissions to fork any new processes.
But the socket idea caught our eye. It seemed like it might be the ticket. The basic premise is:
- Quickly open a connection to the server
- Write to the socket as soon as it is ready
- Close the connection immediately post-write
Granted, it’s not truly asynchronous but it would be quick. Think of it like a basic fire-and-forget. We got to work and started to test it. The first thing to do was to refactor the streaming functionality out of the original endpoint and into its own PHP script.
Once that was done, within the original endpoint (the one getting the pings from the browsers) we needed build up a URL to point to the newly refactored code, manually roll the headers and payload, open the socket, write to it and close it. We found this post on stackoverflow which gave us the foundations for the code.
//The URL which does the actual streaming to BigQuery $url = 'http://bigquery.streaming.ie/StreamToBigQuery.php';Next, construct the payload (parameters) like before:
$arr = array ( 'name' => 'Graham', 'birth_town' => 'Dublin', 'lives' => 'Melbourne, Australia' 'hobbies' => 'Mountain Biking and Beer' 'time_stamp' => time() );And finally, create some socket magic:
foreach ($arr as $key => &$val) { if (is_array($val)) $val = implode(',', $val); $post_params[] = $key . '=' . urlencode($val); } $post_string = implode('&', $post_params); $parts = parse_url($url); $fp = pfsockopen($parts['host'], isset($parts['port']) ? $parts['port'] : 8080, $errno, $errstr, 5); $parts['path'] .= '?' . $post_string; $out = "POST " . $parts['path'] . " HTTP/1.1\r\n"; $out .= "Host: " . $parts['host'] . "\r\n"; $out .= "Content-Type: application/x-www-form-urlencoded\r\n"; $out .= "Content-Length: " . strlen($post_string) . "\r\n"; $out .= "Connection: Close\r\n\r\n"; if (isset($post_string)) $out .= $post_string; fwrite($fp, $out); fclose($fp);With this approach we saw our average response times under load testing drop to less than 100ms. We were sold but still acutely aware that it wasn’t really asynchronous and that scaling up would require a check of
ulimitandTIMED_WAITto make sure the servers were able to cope with the amount of sockets being opened. But our initial loads tests showed no problems at all.As a quick side note you can can actually check out my post on stackoverflow here asking about how to get around this problem.
“Sexy Graphs”
So, we’d implemented the core component which was streaming the data real-time into BigQuery. Next up was a straight forward Spring application that used the Google Java library to talk to BigQuery and provide a REST interface for the front-end. I’m not going to delve into the mechanics of that in this blog post. Instead, let’s take a look at how we actually animated the data through visualisations.
The charting library we used was Chart.js and it was super easy to use and get up and running with. It provides a total of 5 basic charts and has a responsive design so it renders perfectly fine on mobile devices as well. At its core, it uses the HTML5 canvas to render the charts which works really well for the animations.
The 5 charts available are:
- Line
- Bar
- Radar
- Polar Area
- Pie & Doughnut
This was more than enough for what we needed for the project. However, it was missing one core chart that the client had requested – an interactive map showing the impressions and clicks. But that was an easy one. We used the Google Maps API to implement that part.
But a big question still remained – should we ‘poll‘ or ‘push‘ the data from BigQuery and to the client/browser?
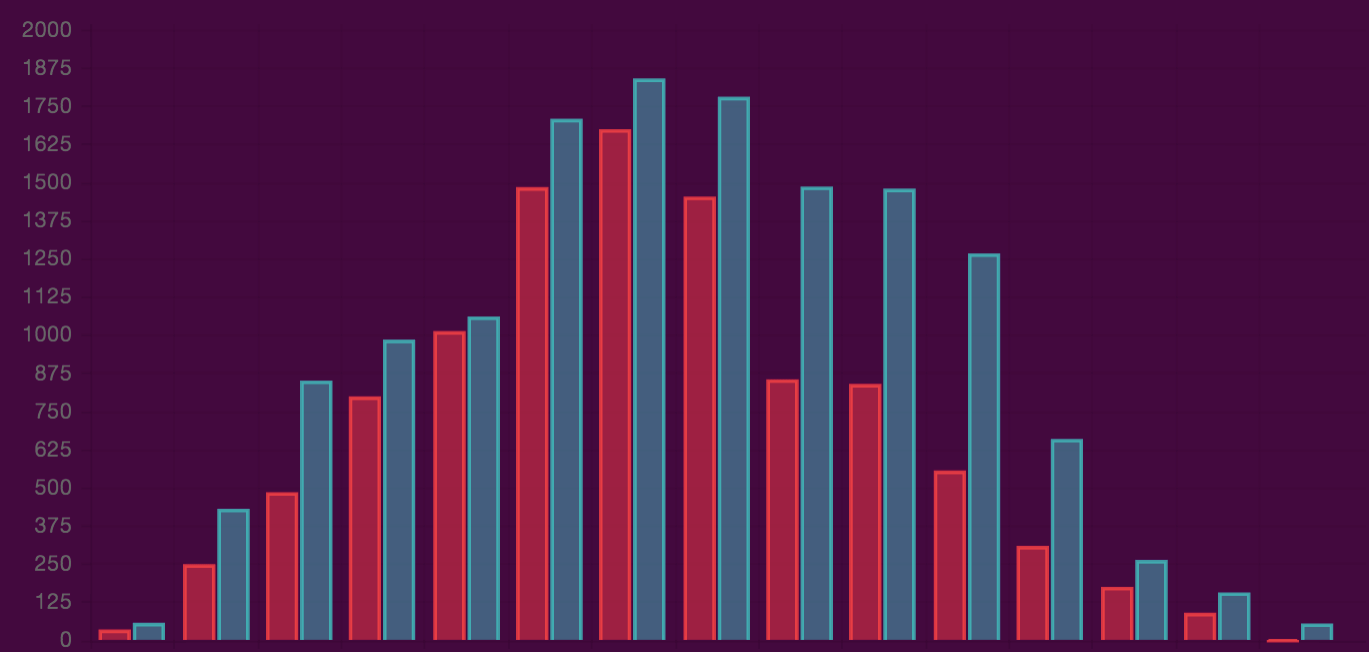
For the initial cut of the application we settled on simply polling the data on 3 second intervals. Using BigQuery’s table decorator feature to limit the amount of data processed, we queried the real-time data that was flowing in concurrently and fed those results (simple JSON) back into Chart.js to build a visual dashboard of the data. And the results were impressive for an open source, easy to use charting library.
Unfortunately, the screenshots just don’t do the animations justice. Trust me, they move and look sexy!
That’s All Folks!
The thought of trying to undertake this project 10, 5 or even just 3 years ago makes me realise how far software development has advanced in the last couple of years. It’s phenomenal. To deliver a project like that and in that time frame just wouldn’t have been doable before now.
Quite simply, the vast array of technologies now available on tap via the cloud is astonishing. What to query a TB in a few seconds? No problem. Want to stream millions of rows real-time into a database table? Well, that’s no problem too. What to scale up to billions or even trillions or rows? Well…you get the picture.
We, as software professionals, have so much more power now to wield courtesy of companies like Google and Amazon. How we build software has fundamentally changed – and only for the better. It’s a thrilling time. It’s a time that will be written in the technology history books. Cloud computing is watering the seeds of disruption. It’s got its dancing shoes on and it’s ready to put on one hell of show.

Anuj S Pandit
Posted at 19:49h, 12 DecemberHi Graham
This is a wonderful post and very helpful. Thank you!
A thought on the async bit … to speed up things, we could push the log entry to an in-memory queue and a backend job on the server can push the messages to big query. Does that sound right? or does it defeat the ‘real-time’ purpose?
Would be great to hear what you think.
Regards
Anuj
Graham Polley
Posted at 20:41h, 12 DecemberAbsolutely Anuj! It’s funny you wrote this comment today of all days. We recently migrated all our infrastructure to AWS so we have a lot more flexibility now. Literally just today we were discussing a better approach to our async problem as it won’t scale to what we need. We came up with exactly the same idea you’ve proposed. We’re planning on using Redis as our in-memory queue (possibly using the pub/sub feature – http://redis.io/topics/pubsub) and using a Python job on the server which will stream the event using the Google Python client lib. Stay tuned for my follow up to see how it went!
anujspandit
Posted at 21:45h, 12 DecemberThanks for taking the time to respond. I have subscribed to the blog will be great to hear about how things go – good luck :). We are at a stage where we have lots of information that we report on, on SQL server. Events get onto Rackspace’s Cloud Queues from where we push them to SQL Server. But now, we are looking at BigQuery to hold it instead. Your post has helped a lot – thanks again!
Sidenote:
Pretty intriguing, the timing of this discussion like you said. My father often says that our thoughts and what we speak is stored on a system on the cloud (literally). I think he is right and It is probably an infrastructure like BigQuery, a public dataset – available to query by the universe ;).
-Anuj
Graham Polley
Posted at 11:50h, 19 DecemberHey Anuj,
You might like to check this out 🙂
http://blog.shinetech.com/2014/12/19/license-to-queue/#more-6118
Anuj S Pandit
Posted at 20:20h, 07 JanuaryThanks for pointing me to that, Graham. Read it, very comprehensive and insightful.
-Anuj
Pingback:License to Queue | Shine Technologies
Posted at 11:03h, 19 December[…] joined an exciting project with fellow Shiner Graham Polley, who you might know from such hits as Put on your streaming shoes. This is a follow-up article, discussing the elegant way in which we solved a hideous asynchronous […]
Camilo S.
Posted at 04:20h, 23 AprilHi Graham,
Thanks for the article. Have you found issues with dupes on BigQuery’s end dring the streaming? Also how reliable has it been (a lot vs few error responses)?
I noticed you set the $row->setInsertId(null);
If you did mitigate or found issues with dupes; did changing the above definition to an id helped to resolve this issue in any way?
Thanks for your thoughts.
Graham Polley
Posted at 14:46h, 23 AprilHi Camilo,
Thanks for comment.
We’ve not experienced any dupe problems to date. However, you’re right. Setting the “insertId” should be done to try and mitigate any dupes. If memory serves me correctly, BigQuery honours the insertId for a 60 seconds and tries to avoid duplicates as best it can – but it’s guaranteed.
Reliability wise, we do get some insert errors (i.e. failed inserts) even with a back-off and retry logic baked into the application. I just check our error logs, and our error rate for the last 24hrs is 0.09%. It usually shows up as a 500 “Service unavailable”. That % it is acceptable for us.
Cheers,
Graham
Srinivas
Posted at 21:58h, 20 AugustThis was a lovely article covering everything end-to-end. You have used a poll mechanism for showing the results on the browser. What can we do if we need some kind of a “publish” mechanism from BigQuery to subscribing web-apps and subsequently using WebSockets into the browser?
Graham Polley
Posted at 09:20h, 21 SeptemberYou could possibly use Pub/Sub – https://cloud.google.com/pubsub/docs
kierans777
Posted at 10:47h, 09 SeptemberVery interesting article. However I’m really surprised that NodeJS (or Akka if you want to stay in Java land) wasn’t in the tech mix for this solution
Graham Polley
Posted at 09:20h, 21 SeptemberAh yes, the “why the heck did you use PHP?!” question 😉 Like I wrote in the post, this was because it was already heavily used within our client’s environment and unfortunately we didn’t have any other languages or technologies at our disposal on the web tier of their infrastructure. If we had more flexibility then we absolutely would of went Java or possibly Node.
kierans777
Posted at 09:51h, 21 SeptemberAh clients. Projects would often run so much better without them :p