

30 Dec 2016 Generating high-res maps with Mapnik and Docker
I have been working on a project that is a real-estate web portal. One of the main features of the portal is maps. You can search for a property on the map using certain criteria. You can see what other objects – supermarkets, hospitals, kindergartens – are located near it, or you can drill into information about specific properties.
Initially I choose to use OpenStreetMap to render maps, the main reason being the level of detail that it provides. For instance, you can see things like factories, industrial zones, suburb borders, schools, etc. This information is quite important when you are looking for a new place to live.
But (and there’s always a ‘but’), I ran into a problem when I got my first Retina MacBook Pro. Maps looked a bit blurry on it. It turned out that the problem was the Retina (hi-res) display.
What I needed was special tiles that rendered with a bigger scale factor to make them sharper. I was looking for a free, ready-to-use solution, but couldn’t find one. There are some commercial projects that you can use, but they cost money, which we didn’t really have for that project.
Furthermore, I needed to keep tile format the same so I don’t need to make any modifications on front end.
Fortunately, OpenStreetMap not only serves up map tiles, but gives you access to the huge geo database underneath as well. So, I decided to render my own tiles from this database.
In this article I’ll present my solution. Importantly, this solution will use Docker to build and run. Using Docker helps avoid problems running shared libraries across different platforms, because most of the tools in that area written with C++. The hope is that you’ll be able to easily setup this solution in your own environment.
Let’s get started
To support Retina image display, we need to generate tiles with 2x resolution. The web client can then request these images and render them into the same sized area on a web page that was previously being used for the non-Retina images.
For instance, if we have an image ‘foo.png’ with a size 128px x 128px that is being rendered by an tag, the client will implicitly give that
tag an area of 128px x 128px. For a Retina-grade image, we would now have the client request an image with size 256px x 256px, but explicitly keep the display area at 128px x 128px.
So instead of having the client request pre-rendered tiles from the OpenStreetMap.org service, we’ll have it request them from a custom back-end that can render high-resolution tiles. Also, rendering our own tiles can be handy if:
- We want to customise how map looks, i.e. create our own look and feel.
- We want to have control of what objects we want to show on the map (roads/rivers/building/etc).
Generally speaking, if you need flexibility and you have compute resources, then rendering tiles yourself is the way to go. Let’s take a look at the solution!
Solution Overview
We will setup our own render server with a custom map style. That renderer will generate map tiles as png images with scale factor 2. We need a custom style mainly to change the font size, because it’s too big for the new tiles. Otherwise, objects would be rendered closer together, but the font size would remain the same. Also, it’s handy to be able to change a style to use our own colour scheme or drop some object type that we don’t need.
As an example, our solution will render Melbourne city. It will render a map that will look like this: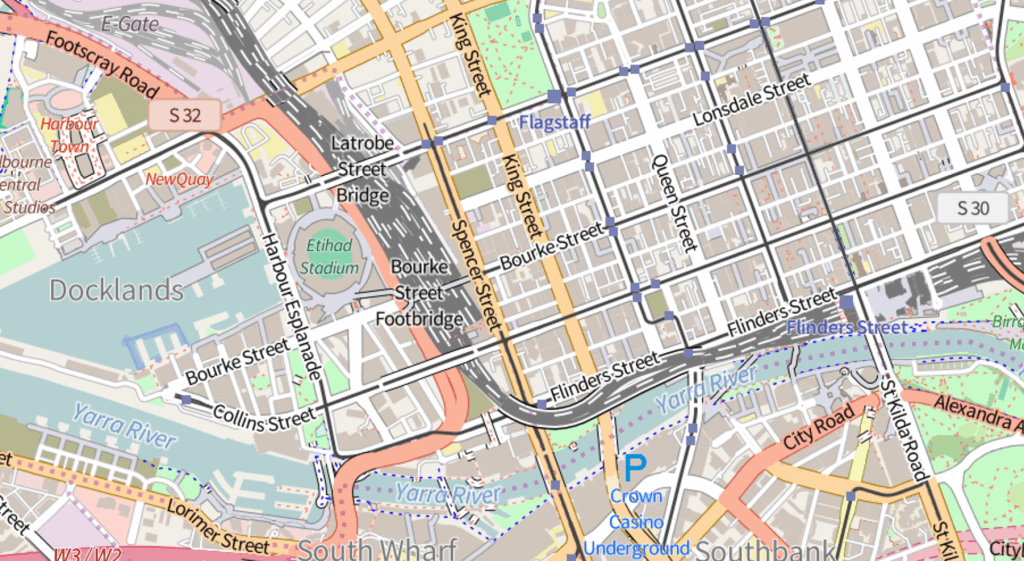
Which we can contrast to the original one from openstreetmap.org:
Here are projects that the solution will use to render our tiles:
- Mapnik: It’s our base tool that does the actual rendering. We use it as a library to call from golang to render tiles.
- Postgis + Postgresql: We store the maps in Postgresql DB using the Postgis plugin. Mapnik requests data from that DB.
- Gopnik:This is a frontend server that calls libmapnik to render tiles. This project is using a master-slave pattern and allows you to create cluster of renderers. Also, it’s written with Golang 😉 – I couldn’t miss that opportunity to hack with it a bit!
- Map Style: A fork of the original OSM style project that I optimised for hi-res displays by supporting 2x size tiles and using different font sizes.
Building It
NOTE: For this to work on your machine, you should have ports 8888,8080,8090 open and free on your host machine.
$ git clone https://github.com/dooman87/melbourne-map.git
$ ./download.sh
Now let’s have a look at docker-compose.yml:
| version: '2' | |
| services: | |
| postgis: | |
| build: ./postgis | |
| volumes: | |
| - ./data:/var/lib/postgresql/data | |
| environment: | |
| - POSTGRES_DB=gis | |
| renderer: | |
| build: ./renderer | |
| volumes: | |
| - ./renderer/map_data:/map_data | |
| - ./renderer/scripts:/scripts | |
| volumes_from: | |
| - postgis:ro | |
| ports: | |
| - "8080:8080" | |
| - "9090:9090" | |
| depends_on: | |
| - postgis | |
| web: | |
| image: nginx:1.11-alpine | |
| volumes: | |
| - ./web:/usr/share/nginx/html | |
| ports: | |
| - "8888:80" |
You can see that we have 3 services. Let’s have a look at each a bit closer:
1. Postgis Service
This service runs a database that contains imported data for Melbourne city. This data has been extracted from OpenStreetMap by the guys at the mapzen project, and is also open source (you can find extracts for all big cities there). The Docker image itself is based on a postgis image that was created by mdillon. I added the osm2pgsql package because we depend on it to import map data into the database. The entire Dockerfile is quite small and simple:
| FROM mdillon/postgis:9.5 | |
| WORKDIR / | |
| RUN apt-get update && \ | |
| apt-get install -y osm2pgsql git wget && \ | |
| rm -rf /var/lib/apt/lists/* | |
| RUN git clone https://github.com/dooman87/openstreetmap-carto.git && \ | |
| wget https://s3.amazonaws.com/metro-extracts.mapzen.com/melbourne_australia.osm.pbf | |
| #Overriding init script to add hstore extension that osm2pgsql requires | |
| COPY ./initdb-postgis.sh /docker-entrypoint-initdb.d/postgis.sh |
We clone the openstreetmap-carto project because it defines what objects we will render, as osm2pgsql will need to know what objects should be imported into the DB. The project contains a file called openstreetmap-carto.style that defines objects and has simple structure of things that will be in DB. For example, here’s a fragment of the file:
| # OsmType Tag DataType Flags | |
| node,way access text linear | |
| node,way addr:housename text linear | |
| node,way addr:housenumber text linear | |
| node,way addr:interpolation text linear | |
| node,way admin_level text linear | |
| node,way aerialway text linear | |
| node,way aeroway text polygon | |
| node,way amenity text polygon | |
| node capital text linear | |
| ... | |
| ... |
So, for example if we don’t want to have labels on capitals, then we can simply remove the line with that type from the file.
Also, I had to customise the Docker entrypoint script to import map data on first start of the container, and create a flag-file to let the renderer know that the database has been successfully imported (last two lines):
| #!/bin/sh | |
| set -e | |
| # Perform all actions as $POSTGRES_USER | |
| export PGUSER="$POSTGRES_USER" | |
| # Create the 'template_postgis' template db | |
| psql --dbname="$POSTGRES_DB" <<- 'EOSQL' | |
| CREATE DATABASE template_postgis; | |
| UPDATE pg_database SET datistemplate = TRUE WHERE datname = 'template_postgis'; | |
| EOSQL | |
| # Load PostGIS into both template_database and $POSTGRES_DB | |
| for DB in template_postgis "$POSTGRES_DB"; do | |
| echo "Loading PostGIS extensions into $DB" | |
| psql --dbname="$DB" <<-'EOSQL' | |
| CREATE EXTENSION postgis; | |
| CREATE EXTENSION postgis_topology; | |
| CREATE EXTENSION fuzzystrmatch; | |
| CREATE EXTENSION postgis_tiger_geocoder; | |
| CREATE EXTENSION hstore; | |
| EOSQL | |
| done | |
| #import Melbourne city | |
| osm2pgsql --style /openstreetmap-carto/openstreetmap-carto.style -d gis -U postgres -k --slim /melbourne_australia.osm.pbf | |
| touch /var/lib/postgresql/data/DB_INITED |
2. Renderer Service
This is the renderer that generates tiles using Gopnik. The image below is showing how exactly rendering process is working. “Dispatcher” and “Render” are Gopnik’s components. We are using normal filesystem as a cache. Mapnik is used as a library that “Render” component calls:

Image was created by gopnik team. Original address: http://sputnik-maps.github.io/gopnik/img/render.png
| FROM dpokidov/gopnik | |
| RUN apt-get update && \ | |
| apt-get install -y git curl unzip node-carto mapnik-utils fontconfig && \ | |
| rm -rf /var/lib/apt/lists/* | |
| WORKDIR / | |
| RUN wget https://github.com/adobe-fonts/source-sans-pro/archive/2.020R-ro/1.075R-it.tar.gz && \ | |
| tar -xzvf 1.075R-it.tar.gz && \ | |
| mkdir /usr/share/fonts/truetype/sourcepro-ttf/ && \ | |
| cp source-sans-pro-2.020R-ro-1.075R-it/TTF/*.ttf /usr/share/fonts/truetype/sourcepro-ttf/ && \ | |
| fc-cache && \ | |
| rm 1.075R-it.tar.gz && \ | |
| rm -rf source-sans-pro-2.020R-ro-1.075R-it | |
| RUN git clone https://github.com/dooman87/openstreetmap-carto.git | |
| WORKDIR /openstreetmap-carto | |
| ADD shapes/ data/ | |
| RUN shapeindex --shape_files \ | |
| data/simplified-water-polygons-complete-3857/simplified_water_polygons.shp \ | |
| data/water-polygons-split-3857/water_polygons.shp \ | |
| data/antarctica-icesheet-polygons-3857/icesheet_polygons.shp \ | |
| data/antarctica-icesheet-outlines-3857/icesheet_outlines.shp \ | |
| data/ne_110m_admin_0_boundary_lines_land/ne_110m_admin_0_boundary_lines_land.shp | |
| RUN mkdir /map_data | |
| VOLUME /map_data | |
| RUN mkdir /scripts | |
| COPY scripts/compile_style.sh /scripts | |
| COPY scripts/run_render.sh /scripts | |
| COPY entrypoint.sh / | |
| RUN chmod 755 /scripts/*.sh && \ | |
| chmod 755 /entrypoint.sh | |
| WORKDIR / | |
| ENTRYPOINT /entrypoint.sh |
- It installs the Adobe Source Pro fonts that get used by map style
- It clones the map style repo
- It creates indexes from shape files that were downloaded in the first step
- It defines a volume called ‘map_data’. That volume contains a ‘config.json’ file that we pass to gopnik. Most importantly, config.json defines the scale factor (line 72) that we want to use to generate tiles:
"Cmd": ["/gopnik/bin/gopnikslave",
"-stylesheet", "/openstreetmap-carto/stylesheet.xml",
"-pluginsPath", "/usr/lib/mapnik/2.2/input",
"-fontsPath", "/usr/share/fonts",
"-scaleFactor", "2"]
- It copies scripts to compile the style and run the Gopnik dispatcher and render slaves
| #!/usr/bin/env bash | |
| sh /scripts/compile_style.sh | |
| while [ ! -e /var/lib/postgresql/data/DB_INITED ] | |
| do | |
| sleep 5 | |
| echo "Waiting while database is initializing..." | |
| done | |
| #Have to wait because once DB created then osm2pgsql restarting postgres. | |
| #TODO: Using pg_isready | |
| echo "DB successfully created, waiting for restart" | |
| sleep 60 | |
| echo "Starting renderer" | |
| sh /scripts/run_render.sh |
3. Web Service
This is a docker container that uses a ready-made nginx image to serve up a simple example web page. It uses the leaflet library to show a map and position at Melbourne:
| <!DOCTYPE html> | |
| <html> | |
| <head> | |
| <meta charset="utf-8"/> | |
| <link rel="stylesheet" href="http://cdn.leafletjs.com/leaflet-0.7.1/leaflet.css" /> | |
| <script type="text/javascript" src="http://cdn.leafletjs.com/leaflet-0.7.1/leaflet.js"></script> | |
| <style type="text/css"> | |
| html, body, #map { | |
| width: 100%; | |
| height: 100%; | |
| margin: 0 !important; | |
| overflow: hidden; | |
| } | |
| </style> | |
| </head> | |
| <body> | |
| <div id="map"></div> | |
| </body> | |
| <script type="text/javascript"> | |
| var map = L.map('map').setView([-37.8130, 144.9484], 14); | |
| L.tileLayer('http://localhost:8080/{z}/{x}/{y}.png', { | |
| attribution: 'Map data © <a href="http://openstreetmap.org">OpenStreetMap</a> contributors, <a href="http://creativecommons.org/licenses/by-sa/2.0/">CC-BY-SA</a>, Imagery © <a href="http://cloudmade.com">CloudMade</a>', | |
| maxZoom: 18 | |
| }).addTo(map); | |
| </script> | |
| </html> |
Starting It
To run things, you need to run the following command in your repository clone:
$ docker-compose up
postgis_1   | LOG:  autovacuum launcher started
renderer_1  | Starting renderer
renderer_1  | 2016/12/27 23:34:30 app.go:266: [INFO] Serving debug data (/debug/vars) on %s... :9080
renderer_1  | 2016/12/27 23:34:30 app.go:267: [INFO] Serving monitoring xml data on %s... :9080
renderer_1  | 2016/12/27 23:34:30 renderselector.go:209: [DEBUG] ping error %v dial tcp 127.0.0.1:8090: getsockopt: connection refused
renderer_1  | 2016/12/27 23:34:30 renderselector.go:117: [DEBUG] '%v' is %v localhost:8090 Offline
renderer_1  | 2016/12/27 23:34:30 main.go:118: [INFO] Starting on %s... :8080
renderer_1  | 2016/12/27 23:34:30 app.go:266: [INFO] Serving debug data (/debug/vars) on %s... :9090
renderer_1  | 2016/12/27 23:34:30 app.go:267: [INFO] Serving monitoring xml data on %s... :9090
renderer_1  | 2016/12/27 23:34:35 main.go:95: [INFO] Done in %v seconds 4.84147165
renderer_1  | 2016/12/27 23:34:35 main.go:103: [INFO] Starting on %s... :8090
Testing it
http://localhost:8888
Shipping It
How you ship this solution is really up to you. I’m using this in a project that has about 300 hits per day (what a big boy!). I’m running all the containers on one EC2 instance. Also, if you cache all tiles that are already rendered, then you won’t need huge CPU resources and – up to a point – may even have some resilience if the Gopnik renderers go down. You can even get the Gopnik renderers to prerender tiles if you want.
That said, strictly speaking this is not a production-ready solution. From gopnic’s docs:
Code is unstable. Current status of Gopnik is something like developer preview. Everything may change. Everything may be broken.
Regardless, it’s probably worth mentioning that uptime of my EC2 instance is currently 5412 hours (was launched on May 18, 2016) and it’s still serving tiles.
Where is NEW YORK, PARIS, MOSCOW, MILAN?
It’s quite easy to render other cities. Just update the Postgis Dockerfile to download a different pbf file and update its name in the entrypoint script.
wget https://s3.amazonaws.com/metro-extracts.mapzen.com/melbourne_australia.osm.pbf
osm2pgsql --style /openstreetmap-carto/openstreetmap-carto.style -d gis
-U postgres -k --slim /melbourne_australia.osm.pbf
$ ./clean.sh
$ docker-compose build
$ docker-compose up
What’s Next?
So that’s my solution for serving up Retina-quality map tiles, packaged up with Docker for easy distribution.
In the ideal world it would be nice to use vector format like svg to render tiles. That way you wouldn’t have to worry about serving up particular resolutions. There are some things going on (http://wiki.openstreetmap.org/wiki/Vector_tiles) in that space, along with commercial solutions.
There is one project that I’d like to mention is osm2vectortiles. You can generate vector tiles from data extracts using it. So, the next step for my project would be to evaluate current solution to generate vector tiles instead of raster.
Michael Leroy
Posted at 08:25h, 03 JanuaryVery informative post, thanks!
Jean-Baptiste Lasselle
Posted at 22:15h, 21 OctoberBonjour Cher Michael, à votre place, je lirai ceci, et le montrerai à mon supérieur héirarchique chez “Shine Solutions”. Mais ce n’est que moi. Bon Dimanche, je vais chercher un bon gâteau à la Boulangerie (pistaches fraises ::o: :love:) :
https://github.com/Jean-Baptiste-Lasselle/jbl-osm-original
Pingback:TEL monthly newsletter – Feb 2017 – Shine Solutions Group
Posted at 21:06h, 08 March[…] Pokidov wrote a post on generating high-res maps using Mapnik & Docker. This is a great read if you’re also a Macbook Retina display user – and also a Docker […]
Cesar Augusto Ribeiro
Posted at 04:18h, 27 SeptemberHello! Thanks for the post. Could you provide some guideline/recommendations for the current style customization (like change color of something or maybe hide specific feature)? I suppose we don’t need to clean everything to do it, or am I wrong? I see that https://github.com/gravitystorm/openstreetmap-carto/blob/master/INSTALL.md#dependencies talk about kosmtik. Is it the recommended tool for graphic customization?
Thanks!